I came across a dataset on kaggle.com regarding work-life balance while searching.
This topic is timely, given that the boundary between work and home is blurring in the context of digitalization. It was important for me to find statistical evidence of how overtime affects mental health.
The «Sleep Health and Lifestyle Dataset» was selected for analysis. It contains data on 374 individuals and includes 13 different parameters characterizing their lifestyle and health status.
The dataset includes the following metrics:
id: A unique identifier for each person. It is used as the primary key to uniquely identify every record in the dataset.
gender: The person’s sex (Male or Female). This is used to analyze differences in lifestyle and health indicators between sexes.
occupation_type: Employment type or profession (e.g., Teacher, Office Worker, Freelancer, etc.). This is used to compare lifestyle and workload across different types of occupations.
avg_work_hours_per_day: The average number of hours spent working per day. It characterizes the individual’s workload level.
avg_rest_hours_per_day: The average number of rest hours per day (excluding sleep). This shows how much time an individual dedicates to recovery and leisure.
avg_sleep_hours_per_day: The average number of sleep hours per day. This is a key indicator of physical and mental health.
avg_exercise_hours_per_day: The average number of hours dedicated to physical activity or exercise per day. This reflects the level of activity and commitment to health.
age_at_death: The age at which the person died. It is used to analyze a possible link between lifestyle and life expectancy.
Data Processing
Using the isnull ().sum () method, I checked the dataset for missing values. The check indicated no empty cells in any columns, and no additional preprocessing was required.
- Distribution of the number of people based on how many hours they work per day
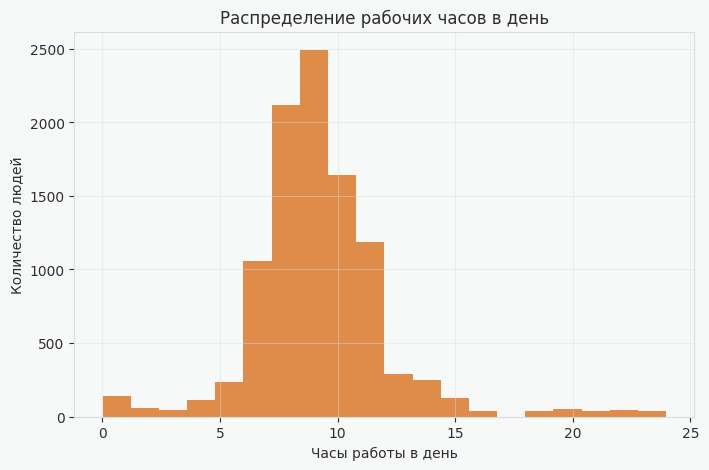
This histogram illustrates the distribution of daily working hours by the number of people. The diagram shows that most people work around 8–9 hours per day, which is expected as this is considered a global standard. It is also worth noting that the majority of people work between 6 and 12–13 hours daily, while a small minority works from 0 to 5 hours or from 13–14 to 24 hours.
The diagram indicates that most people strive not to overwork, yet there is still a significant number of people who do.
- Relating Lifestyle Elements to Life Expectancy
This chart set illustrates the relationship between various lifestyle elements and life expectancy.
The first chart shows that people live longer on average when they work a moderate number of hours (approximately 6–10 hours per day). At very high working hours (more than 15–18 hours per day), the age of death is noticeably lower, suggesting a negative impact from excessive workload.
The second chart depicts the relationship between age of death and sleep duration. The highest life expectancy is observed in individuals who sleep about 6–9 hours per day. With too little or too much sleep, the average age of death is lower.
The third chart reflects the link between leisure time and life expectancy. It is evident that having regular rest is positively correlated with a higher age at death, although the effect becomes less pronounced at very high levels of leisure time.
The fourth chart demonstrates the influence of physical activity. Even a small amount of exercise is associated with a longer life expectancy compared to no activity at all. However, extremely high levels of physical exertion are rare and do not yield a noticeable additional benefit.
Overall, the charts indicate that the longest life expectancy is characteristic of a balanced lifestyle: moderate work, sufficient sleep, regular rest, and reasonable physical activity.
- Work-Life Balance by Employment Type
For each employment type, the average number of hours spent working and sleeping per day is shown.
The chart demonstrates how the work-sleep balance differs across various professions. For example, entrepreneurs and managers work longer hours than others, while their sleep time is relatively shorter. Healthcare workers, drivers, and manual laborers have a more balanced allocation of time. Artists and educators work less on average, but compensate for this with more sleep. This underscores that employment type significantly impacts daily routine and the balance between work and recovery.
- Sleep distribution by gender
Here is a box plot showing the distribution of daily sleep hours, separated for women and men.
Generally, the sleep distributions for men and women are very similar. The average sleep time for both genders is around 7–8 hours per day. However, both groups exhibit outliers, ranging from very little to a very high amount of sleep.
- Daily Time Allocation
Here are histograms showing the distribution of how much time people spend on work, rest, and sleep throughout the day. Each color represents a different activity.
The graph indicates that the largest number of people spend about 6–8 hours sleeping per day, which aligns with general recommendations. Work time is most frequently concentrated in the 7–10 hour range daily, while rest is distributed more evenly and shows greater variation. This suggests that sleep and work have more stable patterns, whereas leisure time is heavily dependent on an individual’s lifestyle.
Conclusion
Having analyzed the data, I learned that the balance between work, sleep, and rest significantly depends on one’s profession, yet remains relatively stable across genders. Most people maintain a moderate schedule of sleep and work, aligning with the concept of work–life balance, where the key factor is not maximizing working hours, but rather a balanced distribution of time throughout the day.
Sources
- Deepseek for consultation on basic chart types and fundamental data analysis libraries in Python
- Kaggle.com
- Krea.ai for cover generation. Prompt: («Split into two parts (vertically): Left: A man working on a laptop in a business suit, with a chart in the background. Background color FCA354 orange. Right: A woman reading a book in an armchair, wearing a comfortable hoodie, with a book and a sunset. Background color 5F9DC8 blue. Center: A person situated at the junction of these two worlds, appearing calm.»)