Project Idea and Concept
I chose this topic because it connects technology, ecology, and data. We increasingly rely on services that depend on satellites: navigation, internet, weather forecasts, maps, and communication. But the more objects launched into orbit, the higher the risk of collisions and the creation of new debris.
The main idea of the project is to present Earth’s orbit as an overburdened system. A single satellite may seem small and safe, but thousands of objects together create a dense and complex environment that requires monitoring.
Main infographic
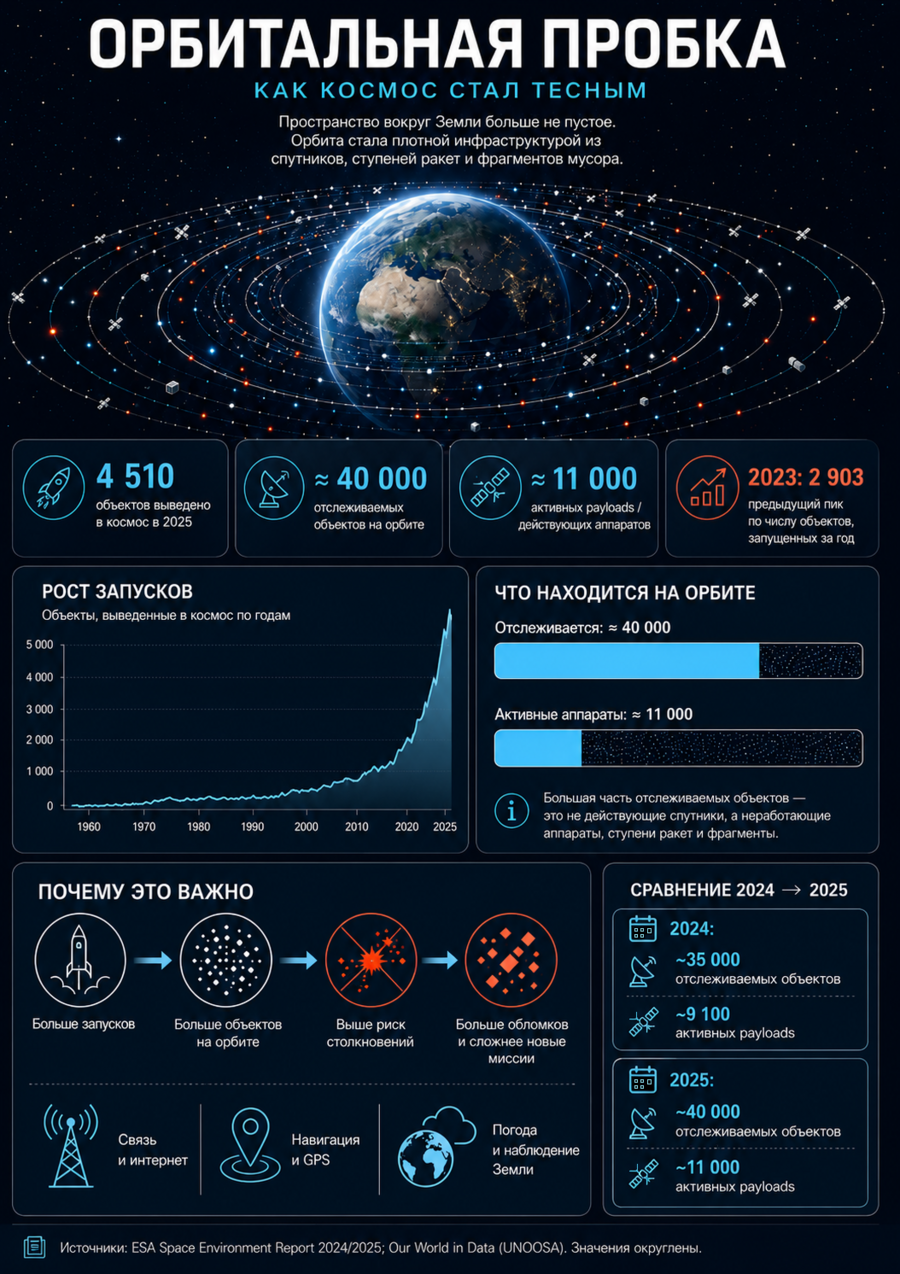
The main infographic is structured as a visual map of an overloaded orbit. Rather than simply presenting a collection of cosmic figures, I divided the poster into several thematic layers.
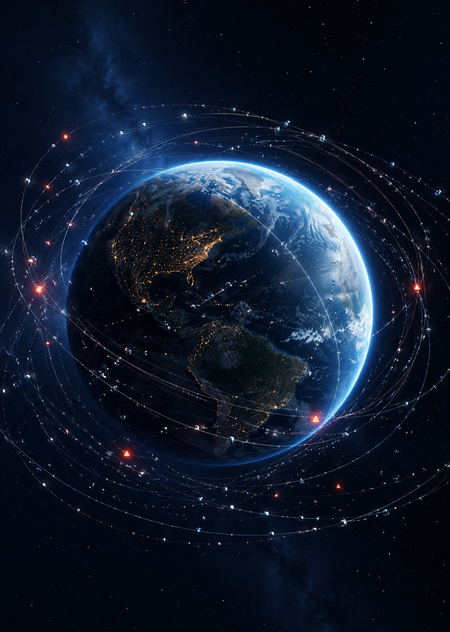
The upper section features the central image: the Earth and a dense network of orbits surrounding it. This immediately conveys the project’s core concept—how space near Earth has become comparable to a transport system.
The central section presents key metrics: the number of launches, satellites, operational objects, and tracked debris. These statistics help illustrate the scale of the problem.
The lower section explains the consequences: the risk of collisions, the creation of new fragments, the necessity of evasive maneuvers, and the importance of regulations for deorbiting satellites after their mission concludes.
The poster’s central thesis is that orbit is a finite resource. If it is not managed, it risks becoming hazardous for future launches and satellite services.
Mockups
The Creation Process
The project was assembled in phases. First, I gathered open-source materials and compiled key metrics into a table. Then, the data was standardized: numbers were rounded, categories were named consistently, and sources were grouped by data type.
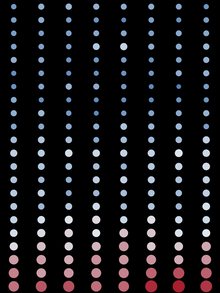
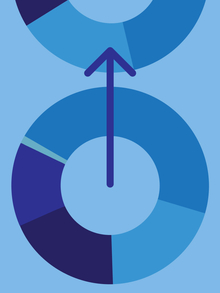
For visualization, I selected several formats: a line graph for launch trends, cards featuring key statistics, and a comparative section based on object types.
AI was utilized during the search for a visual metaphor, generating ideas for the cover, mockups, and refining the textual copy. The final logic of the infographic—the grid structure, hierarchy, annotations, focal points, and reading sequence—was assembled manually.
Source Data and References
European Space Agency: https://www.esa.int/ Our World in Data — Annual number of objects launched into space: https://ourworldindata.org/grapher/yearly-number-of-objects-launched-into-outer-space CelesTrak — Satellite Catalog: https://celestrak.org/satcat/