
concept
This project focuses on analyzing the «Top Video Games 1995–2021 Metacritic» dataset to investigate which factors correlate with high critical and player scores for video games. The work utilizes various types of visualizations to explore the video game industry from multiple perspectives: comparing Metacritic scores with user reviews, examining the influence of platform, release period, game title length, and game series size.
The diagrams show that critics' and player ratings generally correlate, but user perception is more variable and prone to polarization. Special attention is given to games with very high user ratings ($\ge 8.5$), where dominant platforms and the most «successful» periods of industry development are identified. Overall, the project demonstrates that the success of a video game is shaped by a combination of quality, release timing, platform, and market context, rather than a single factor.
A comparative analysis not only of average scores but also of critical consensus (score variance) across platforms (PC, PlayStation, Xbox, Nintendo). The goal is to determine which ecosystem has historically garnered the most unanimous recognition and which is known for polarizing hits.
colors


Games with the best ratings since release
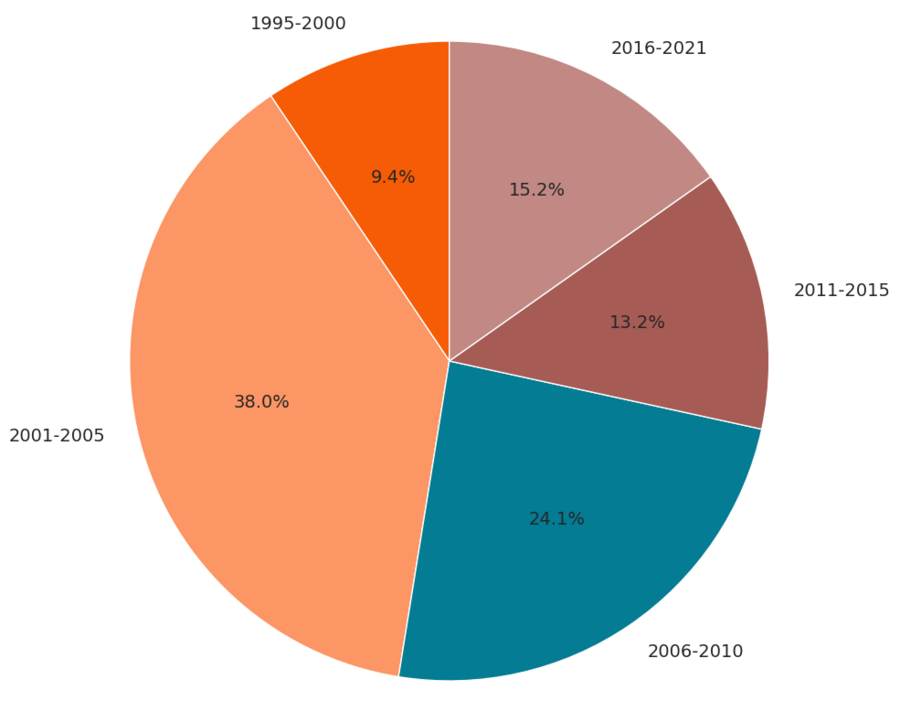
The chart illustrates the distribution of games with the highest user ratings (User Review ≥ 8.5) across release periods within the «Top Video Games 1995–2021 Metacritic» theme. The largest proportion of these games occurred between 2001–2005, which can be considered the peak period for the formation of iconic and most beloved projects. The years 2006–2010 also contributed significantly, as the industry experienced active technological and genre development. The earlier period of 1995–2000 is represented much more weakly, reflecting a smaller volume of releases and an earlier stage of market development. In recent years (2011–2021), the share of highly-rated games is lower, which may indicate increasing competition, higher audience expectations, and shifting user review criteria.
Games with the highest ratings based on the gaming platform (User Review $\geq$ 8.5)
The chart displays the distribution of games with the highest user ratings (User Review $\geq$ 8.5). The largest share of these games comes from PC, which underscores the platform’s strong standing among hardcore and critically engaged audiences. PlayStation 2 «Other» also accounts for a substantial portion, reflecting the contribution of less mainstream or older platforms. Xbox and Nintendo family consoles are represented more moderately but consistently, suggesting the presence of highly acclaimed exclusives. Overall, the graph demonstrates that high user ratings are distributed across various platforms, though PC and PlayStation 2 lead in the number of player-favorite titles.
Average player rating by game title length
This chart illustrates the relationship between the average game title length and user rating within the dataset. Games rated «Good» tend to have the longest titles on average, whereas projects with «Poor» and «Mixed/Average» ratings have shorter titles. However, the differences between the categories are minimal, suggesting a weak dependency between title length and player perception of the game. Overall, the chart underscores that a video game’s success is determined by its quality and content, not by how long or complex its title is.
Distribution of games by Metacritic score and user review categories.
Games rated as Good tend to have the longest titles on average, whereas projects with Poor and Mixed/Average ratings have shorter titles. Nevertheless, the differences between the categories are slight, suggesting no strong correlation between title length and players' perception of the game. Overall, the chart underscores that a video game’s success is determined by its quality and content, not by how long or complex its title is.
Metacritic Rating by Game Count in the Series
The X-axis indicates the number of games in the franchise, and the Y-axis shows Metacritic scores.
The main takeaway is that the mere existence of a long-running series does not guarantee higher ratings. Series with 1–5 games show a wide range of scores—from average to very high—which is characteristic of experiments and new IPs. The most stable and highest median scores are observed in medium-length series (approximately 8–13 games), where the franchises have refined the formula for success but have not yet encountered significant audience fatigue.
With a large number of games in the series (15+), an increase in variability and the appearance of lower scores are noticeable, indicating an «oversaturation» effect: the quality of individual entries becomes less consistent. Overall, the chart emphasizes that in the video game industry, a franchise’s long-term success depends not on the quantity of releases, but on the ability to maintain quality over time.
Metacritic Score vs. User Rating