The project selected a dataset on the platform Kaggle
When I started thinking about the project, I decided to do it about my favorite game, Minecraft. The game has changed a lot since I met her and so far. I was curious to analyze the biomes of Minecraft: the resources, the mubes, and the complexity of survival.
The purpose of the study is to study how biomes are distributed, how rich they are in resources, and whether there is a link between the prevalence of biom and its resource value. The following types of visualizations were used to analyse the data: the horizontal column diagram to compare the total amount of resources in the most common biomes. A horizontal column diagram is used to analyse the frequency of biomes and identify dominant landscape types. The round diagram is for visualization of the shares of the most common biomes relative to the others. A horizontal column diagram is used to compare the average amount of resources in different biomes. Box flat to analyse resource allocation within biomes and to identify the variability of values. The dissipation diagram is for a study of the relationship between the prevalence of biom and the average resource saturation.
Color gamma


I’m focusing on the green-ground shades, because they’re the ones that are associated with this game in many people, including me. It’s also about biomes, which are most often these shades. As a contrast color, I chose #05b24e, the color of Creeper, a hostile bub that blends with the local flora. I chose DejaVu Sans for the font because it’s readable and minimalist.
The use of these methods and visualizations made it possible not only to compare biomes among themselves, but also to draw conclusions on the extent to which they are suitable for survival in the early stages of the game.
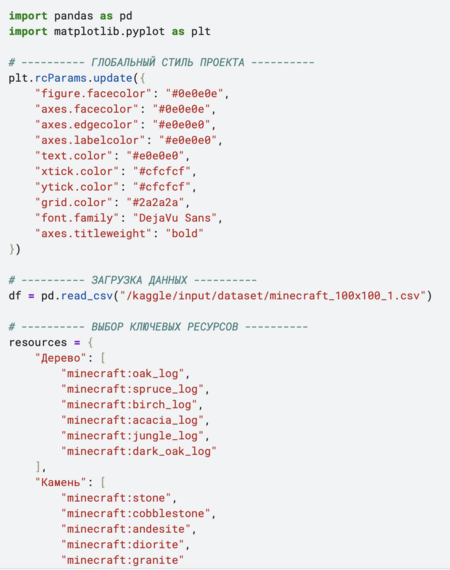
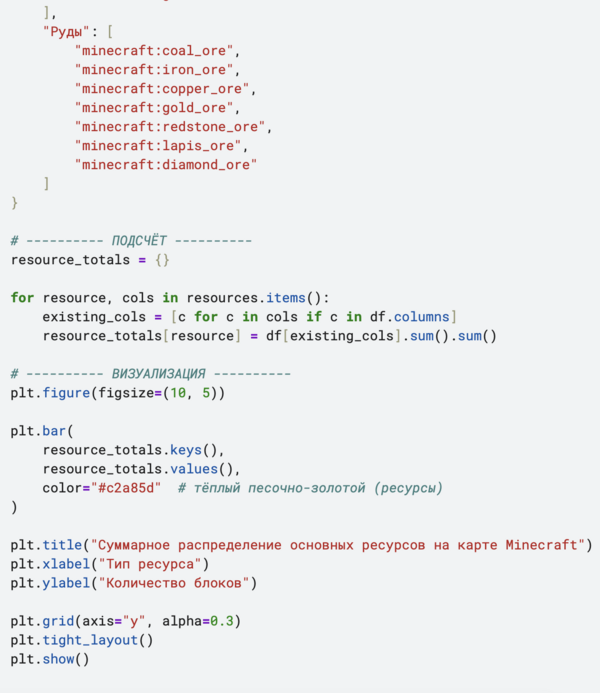
The dataset was downloaded on Wednesday, Kaggle, using the Pandas Library. At this stage, a primary review of the data structure, column names and the availability of passes was carried out.
Columns containing information on biomes and key resources were selected for analysis. On the basis of these, an additional topic was created — the total amount of resources in the cup. Data groupings for bioms were also performed and aggregates were calculated (number of chunks, averages and totals).
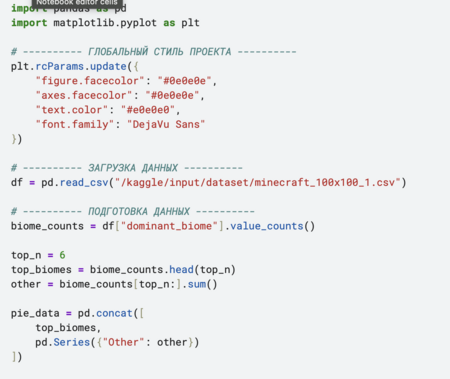
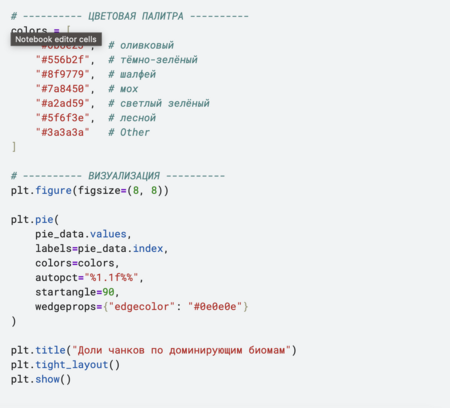
The analysis of the data was as follows: first, we looked at the biomes, then how rich they were in resources. At the end, we studied how resources change within each biome and how it all relates.
Each point is equal to one cup, and the color of the point is equal to the number of resources.
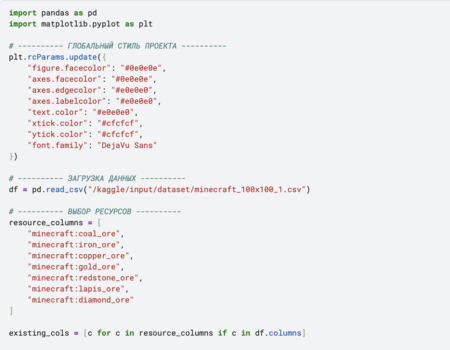
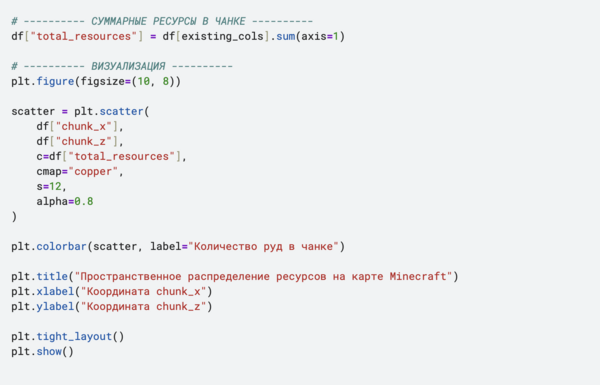
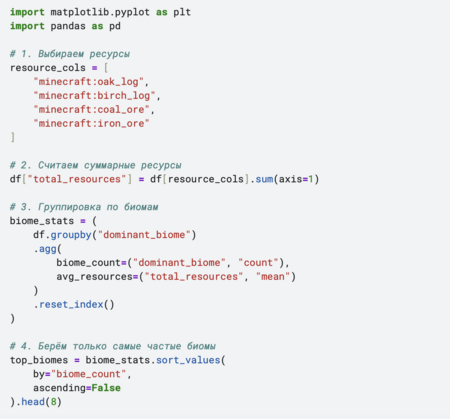

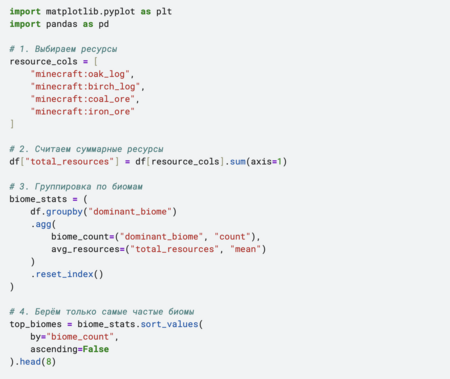
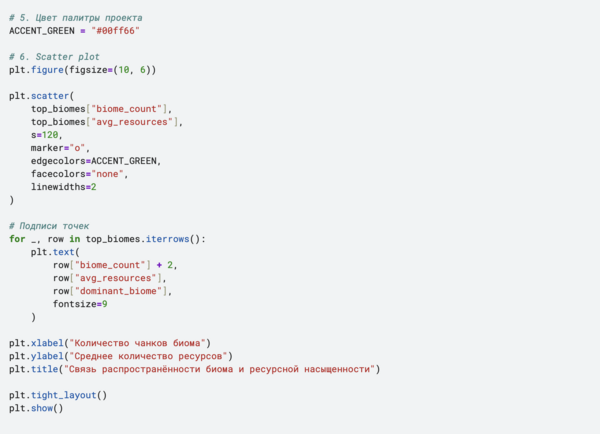
Six visualizations of different types were constructed to present the results of the analysis: horizontal column diagrams, circular diagram, box table and dissipation diagram. The type of each graph was chosen on the basis of which information it most clearly reflected.
Conclusion
So I’ve come to believe that the biomes in the Minecraft world are unevenly distributed: several types of biomes are much more common than others. However, the high prevalence of biom does not always mean its high resource value. Analysis has shown that the average amount of resources varies markedly between biomes, even if they are similar types of landscape. In addition, there is considerable variation in resources within the same biome, indicating the variability in the generation of the game world. The relationship between the incidence of biom and its resource saturation is present, but it is not direct and unambiguous. The use of several types of visualizations allowed the data to be looked at from different angles and a better understanding of the distribution of resources in Minecraft.
Application of generic models
To improve the codes and to help write them, the code used was ChatGP was used to generate the cover ideogram AI