Concept
Following up on the topic of phone dependency, I decided to find a study on a similar topic for data visualization. On hubdata.ru, I found a survey from FOM with data on internet addiction from 2013.

Color Palette
In my view, the color palette effectively conveys the emotional and psychological aspects of internet addiction.
Data Visualization
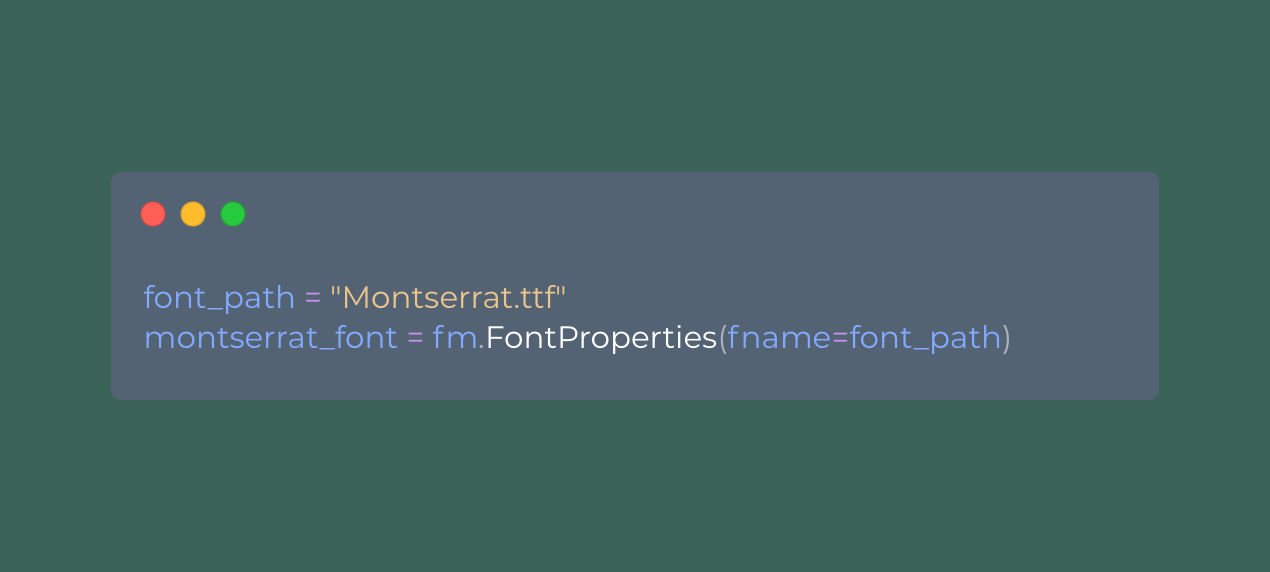
First, I imported the libraries, uploaded the Excel file, and set up the background and font.
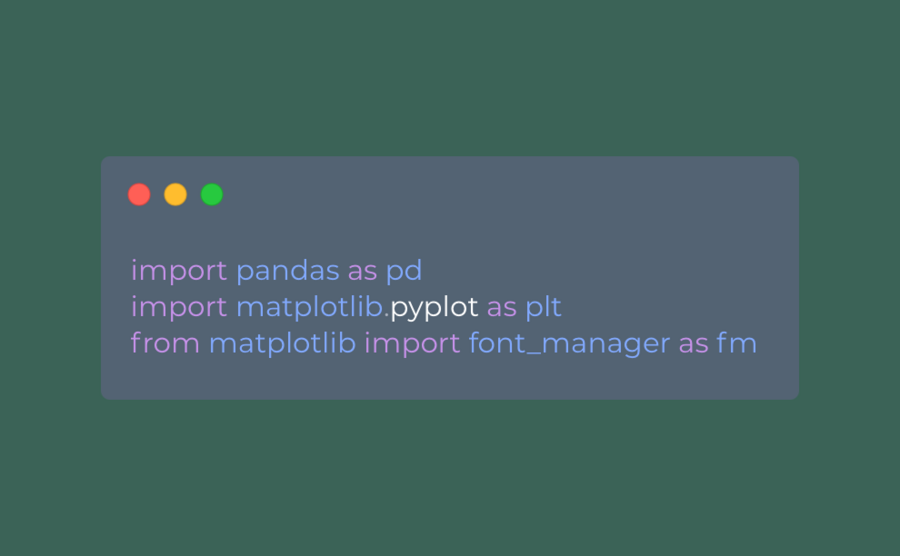
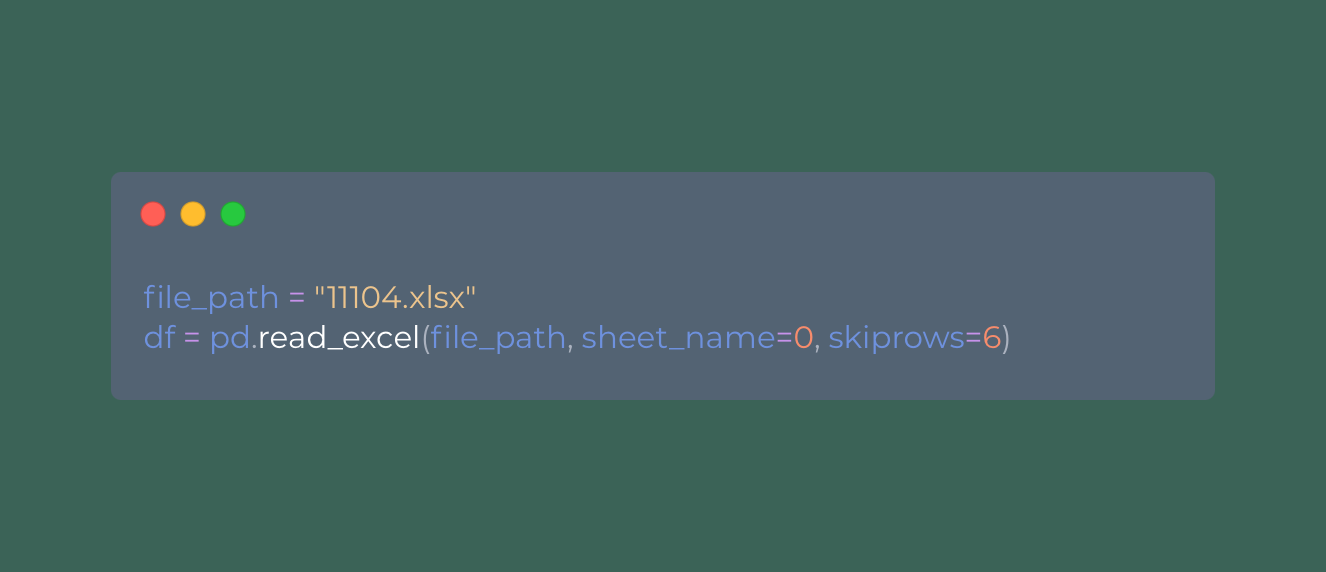
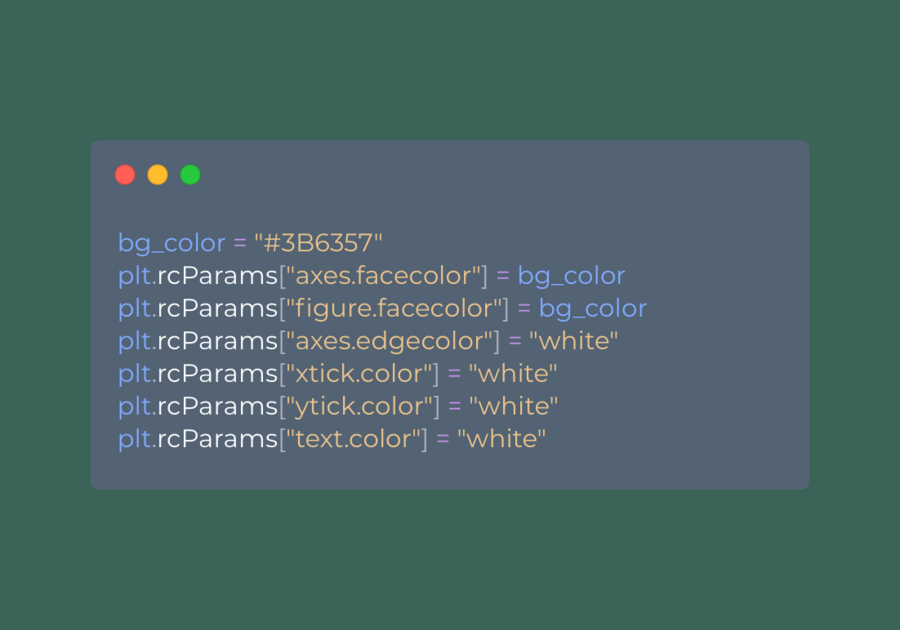
Code 1
1. Internet Usage Histogram by Gender
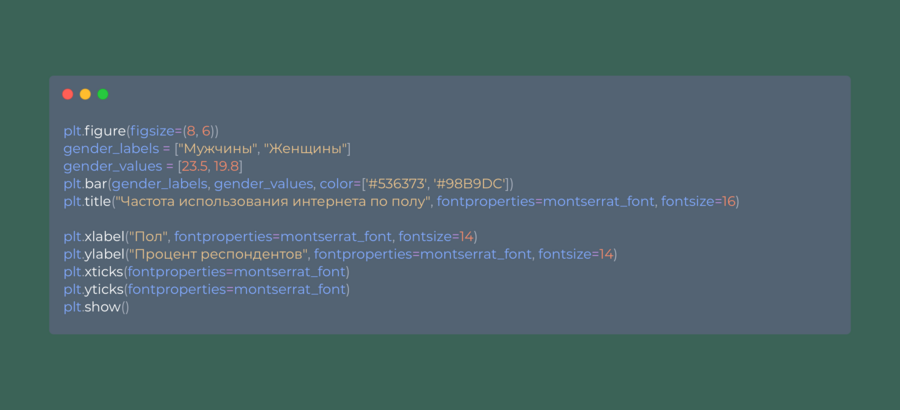
code 2
Histogram
2. Line graph of internet usage by age
code 3
Line graph
3. Income Dependency Pie Chart
code 4
pie chart
4. Bar chart by settlement type
code 5
Line chart
Conclusions
1) Men use the internet slightly more often than women. 2) Internet activity decreases with age: young people (ages 18–30) are the most active, while older adults (over 60) are the least active. 3) The most active users have an income over 20,000 rubles, while the least active have an income of up to 4,000 rubles. 4) The internet is used most actively in large cities and Moscow, and least actively in rural areas.
Description of Generative Models Used
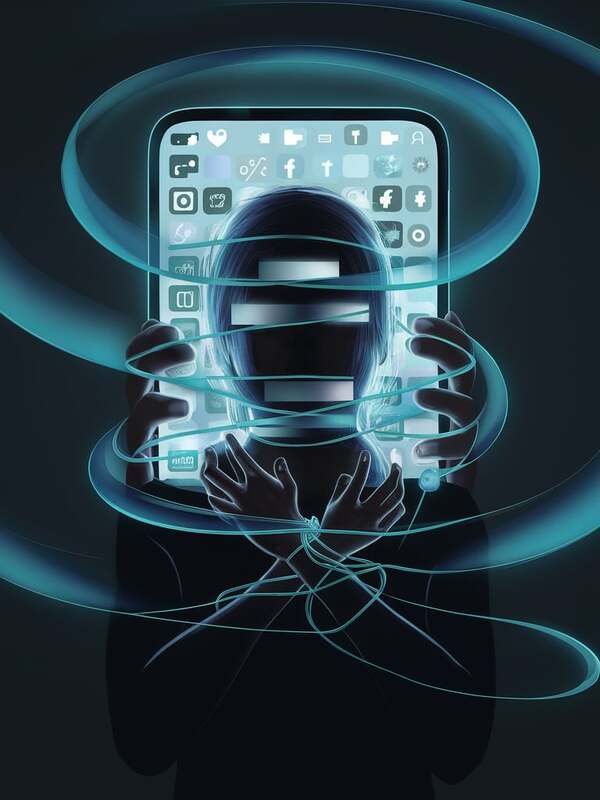
Ideogram — used for creating the cover. Prompt: A haunting digital illustration features a silhouette of a person engulfed in the glow of a screen, as if being pulled into the digital abyss. The central figure’s face is obscured or blurred, emphasizing the loss of identity. Hands seem tied by invisible threads, symbolizing digital chains. The background is a smooth gradient of dark shades, #0D0D0D (almost black) and #133840 (deep teal), creating an immersive feel of digital dependency. The glowing screen of a smartphone or monitor, highlighted by #98B9DC (cool blue), contrasts the hypnotic light of the virtual world with the darkness of reality. Within the screen, blurred symbols of social media, endless news feeds, or notifications may be visible. Chat GPT — code correction. Adobe Color — color palette generation.