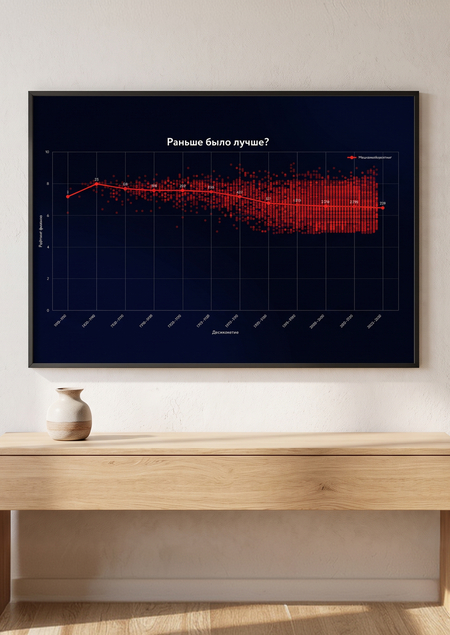
Project Idea
The project «Was It Better Before?» investigates how audience perceptions of films have changed over time. At its core lies a popular debate among cinephiles: do old films truly surpass modern ones, or is the notion of higher quality in past cinema merely a byproduct of nostalgia and our perception of bygone eras? The choice of this topic is driven by widespread interest in this question and the desire to test independently which side of the debate is correct.To test this hypothesis, a dataset containing statistics on 9,849 films is analyzed. Specifically, I am interested in data regarding the release years and audience ratings. Thus, the subjective question, «When was cinema better?» is transformed into a concrete analytical task.The project’s objective is to clearly demonstrate the correlation between a film’s release year and its audience rating, identify possible trends, and determine whether the data supports the opinion that older films are rated higher than contemporary ones.The practical benefit of this infographic is that it allows viewers to look at their own perception of cinema from different eras in a new light. The data analysis helps determine which periods genuinely stand out with high audience ratings and which merely seem to, thanks to a few landmark films. Data visualization can serve as a starting point for discovering films from specific periods and may prompt a re-evaluation of attitudes toward both classic and contemporary cinema.
Infographic
X — the decade the film was released. Y — the film rating from 0 to 10. Dots — individual films in the dataset. Line — the median film rating for each decade. Numbers above the line — the number of films included in the calculation for that decade.
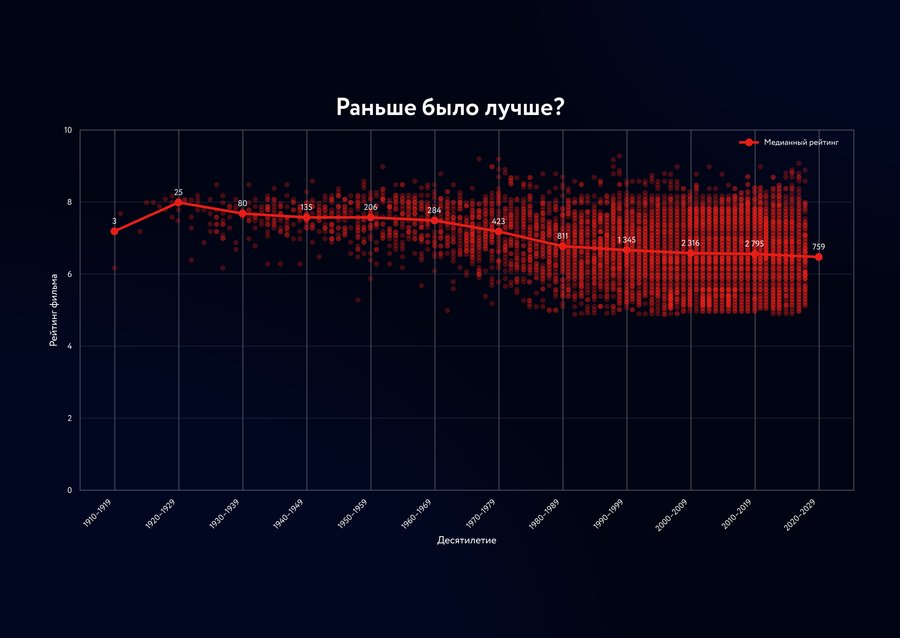
The chart illustrates a decline in the median movie rating over time: dropping from 8.0 in the 1920s to 6.5 in the 2020s. Simultaneously, the number of movies in the dataset has steadily increased, particularly after the 1980s.
Conclusion
The analysis conducted shows that the median rating of the films in the presented dataset gradually decreases over time. The highest values are observed in films from the first half of the 20th century, whereas starting from the 1980s, the median rating drops noticeably, reaching 6.5 in the 2020s. At first glance, this might suggest the common opinion that older cinema was superior.However, one cannot draw a definitive conclusion based solely on the graph. The dataset contains a vastly different number of films across various periods: for example, there are 25 films from the 1920s, while there are 2,795 from the 2010s. Therefore, the results for the early decades may be much more susceptible to the influence of individual films, while the large volume of contemporary films forms a more stable median value.Thus, the graph illustrates a certain trend within the selected dataset rather than proving that old films are objectively better than modern ones. The way the dataset was formed and which films were included may also influence the results. Consequently, the answer to the question, «Was it better in the past?» remains ambiguous, and the visualization serves not so much to provide a final answer as it does to showcase an interesting pattern and prompt the viewer to contemplate the reasons for this discrepancy.
Workflow Pipeline
Data collection from CSV → cleaning and converting the year and rating to numerical format → grouping films by decades → calculating the median rating → generating a chart in Python → adding points for individual films and the number of films per period → visual refinement of the graph.
Original dataset
The resulting schedule