Research Concept
Relevance of the Topic
This research focuses on the Macintosh graphic language as employed in the works of Susan Kare (1982–1984). In the constraints of a monochrome display, she created pictograms and raster fonts, solving challenges in visual communication using limited graphic resources.I am interested in how meaning can be conveyed and recognizable visual symbols created under such conditions. This question directly relates to my interface design practice.Research Material and Logic
The research is based on early sketches, interface pictograms, and Macintosh raster fonts from 1982–1984. These materials were selected considering their historical authenticity and the ability to compare specific graphic techniques.
The research sections focus on individual visual tasks: working with the pixel grid, constructing pictograms, conveying meaning, and creating raster fonts. I then correlate the analysis results to identify the common principles of the graphic language.
I verify the historical context through interviews with Carr, testimonies from development participants, and museum materials from MoMA and SFMOMA. I use Apple documentation and preserved system resources to verify technical specifications and analyze the original graphics.
Research Question and Hypothesis
What graphic techniques did Susan Kare employ to address the challenges of distinctiveness, meaning conveyance, and visual expressiveness in Macintosh pictograms and screen fonts?
I suspect that Kare’s work is not unified by a single aesthetic style, but rather by overarching principles of graphic symbol design. Given identical technical constraints, different objectives may have necessitated diverse visual solutions.
Paper grid, screen pixel
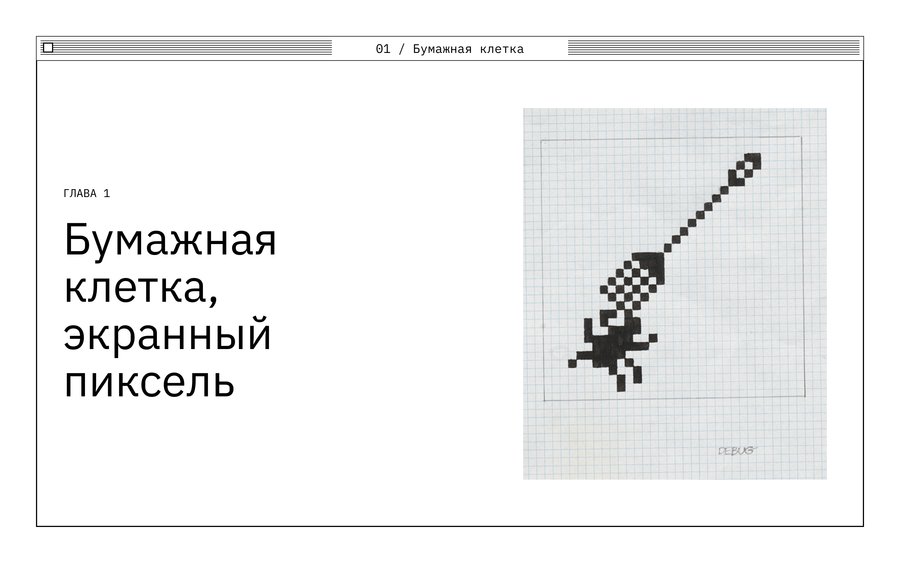
Susan Kare. Graphic icon sketch (Macintosh pictogram sketch, pencil and ink on graph paper, 1982–1983).
Suzanne Carter’s initial graphics sketches for Macintosh were done on graph paper. Even before ready-made on-screen images existed, she experimented with representing objects or actions using a small number of conventional squares. In her sketches, the graph paper served as a pixel grid: one square corresponded to one element of the future image.
Susan Carr. Graphic icon sketch (two fragments from one sketch sheet, 1982–1983).
The preserved sketches illustrate various approaches to sign creation. Carr was not always limited to the first option; she proposed several solutions and discussed them with her colleagues. The sketch was part of the search process, not the final design for the interface.
Carr recalled that for indicating file copying, she experimented with the image of a cat in front of a mirror—a visual play on the words «copy cat.» This option did not make it into the interface. An interesting metaphor does not always translate well to represent a function.
Macintosh. Computer icon (System, 1984). Original 32×32 pixel raster, magnified with grid overlay.
Early Macintosh raster images used black and white pixels. A 32×32 matrix contains 1024 positions; each could be black or white. Even within these constraints, the designer had to decide on the form.
Macintosh. Folder icon and text cursor (Finder / System, 1984). Comparison of 32 × 32 and 16 × 16 pixel raster images.
In Macintosh archival resources, images appear in various sizes—for example, a computer icon at 32 × 32 pixels and a crosshair cursor at 16 × 16. When scaled identically, the difference in workspace size is clearly visible.According to Kerr’s recollections, the early editor allowed users to turn individual pixels on or off. Later, she used MacPaint, which permitted viewing the drawing both enlarged and in its original size. This allowed designers to check the form directly on the screen.
Conclusion
On grid paper, and in digital editors, the image was constructed from individual cells. However, the grid itself did not determine what the mark would be. Next, I will examine the details Kerr maintained to ensure the images remained distinguishable.
Recognizability with minimal signs