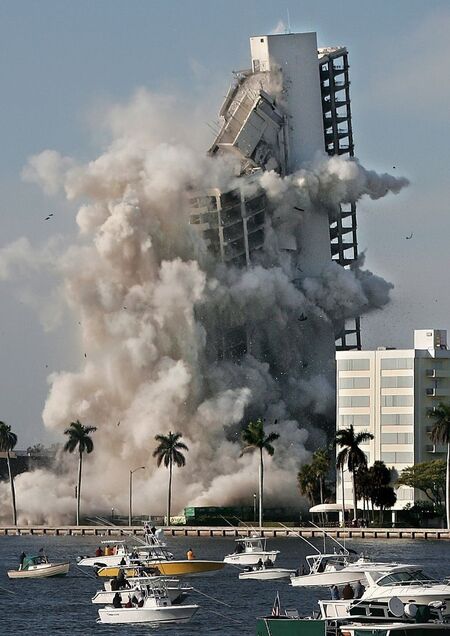
Проект посвящён анализу данных Fragile States Index (FSI) за 2014 год, отражающих политическую, экономическую и социальную устойчивость стран. С помощью Python проведена обработка данных и визуализация ключевых показателей: сравнительный анализ наиболее нестабильных государств, оценка вклада различных групп факторов в общий индекс, а также детальный разбор индикаторов на уровне отдельной страны. Проект наглядно демонстрирует комплексный характер государственной нестабильности и позволяет выявить главные источники рисков.
ГРАФИКИ
СТОЛБЧАТАЯ ДИАГРАММА

График
import pandas as pd import matplotlib.pyplot as plt import numpy as np
plt.rcParams.update ({ «figure.facecolor»: «black», «axes.facecolor»: «black», «axes.edgecolor»: «white», «axes.labelcolor»: «white», «xtick.color»: «white», «ytick.color»: «white», «text.color»: «white», «grid.color»: «white», «legend.facecolor»: «black», «legend.edgecolor»: «white» })
FILE = «fsi-2014.xlsx»
df = pd.read_excel (FILE) df[«Year»] = pd.to_datetime (df[«Year»]).dt.year country = «South Sudan» row = df[df[«Country»] == country].iloc[0]
indicators = [c for c in df.columns if «:» in c] values = row[indicators].values
plt.figure (figsize=(14, 5)) plt.bar (indicators, values, color="white») plt.xticks (rotation=75) plt.ylabel («Score») plt.title (f"FSI Indicators — {country} (2014)») plt.grid (axis="y», linestyle="--», alpha=0.5) plt.tight_layout () plt.show ()
КРУГОВАЯ ДИАГРАММА
График
import pandas as pd import matplotlib.pyplot as plt import numpy as np
plt.rcParams.update ({ «figure.facecolor»: «black», «axes.facecolor»: «black», «axes.edgecolor»: «white», «axes.labelcolor»: «white», «xtick.color»: «white», «ytick.color»: «white», «text.color»: «white», «grid.color»: «white», «legend.facecolor»: «black», «legend.edgecolor»: «white» })
FILE = «fsi-2014.xlsx»
df = pd.read_excel (FILE) df[«Year»] = pd.to_datetime (df[«Year»]).dt.year
factors = { «Cohesion»: [ «C1: Security Apparatus», «C2: Factionalized Elites», «C3: Group Grievance», ], «Economic»: [ «E1: Economy», «E2: Economic Inequality», «E3: Human Flight and Brain Drain», ], «Political»: [ «P1: State Legitimacy», «P2: Public Services», «P3: Human Rights», ], «Social»: [ «S1: Demographic Pressures», «S2: Refugees and IDPs», ], «External»: [ «X1: External Intervention», ], }
group_scores = {g: df[cols].mean ().sum () for g, cols in factors.items ()}
plt.figure (figsize=(7, 7)) plt.pie ( group_scores.values (), labels=group_scores.keys (), autopct="%1.1f%%», startangle=90, textprops={"color»: «white"}, wedgeprops={"edgecolor»: «white"} ) plt.title («Average Contribution of Factor Groups (FSI 2014)») plt.tight_layout () plt.show ()
ЛИНЕЙЧАТАЯ ДИАГРАММА
График
import pandas as pd import matplotlib.pyplot as plt import numpy as np
plt.rcParams.update ({ «figure.facecolor»: «black», «axes.facecolor»: «black», «axes.edgecolor»: «white», «axes.labelcolor»: «white», «xtick.color»: «white», «ytick.color»: «white», «text.color»: «white», «grid.color»: «white», «legend.facecolor»: «black», «legend.edgecolor»: «white» })
FILE = «fsi-2014.xlsx»
df = pd.read_excel (FILE) df[«Year»] = pd.to_datetime (df[«Year»]).dt.year
top10 = df.sort_values («Total», ascending=False).head (10)
plt.figure (figsize=(12, 6)) plt.barh (top10[«Country»], top10[«Total»], color="white») plt.xlabel («Fragile States Index (Total Score)») plt.title («Top 10 Most Fragile States (FSI 2014)») plt.gca ().invert_yaxis () plt.grid (axis="x», linestyle="--», alpha=0.5) plt.tight_layout () plt.show ()
ВЫВОД
Анализ показывает, что высокая государственная хрупкость возникает под воздействием сочетания политических, экономических и социальных факторов, а не одного отдельного показателя. Наиболее нестабильные страны одновременно демонстрируют высокие значения по показателям безопасности, легитимности власти и социального напряжения. Это подтверждает системный характер кризисов государственной устойчивости и подчёркивает важность комплексного подхода к их оценке и предотвращению.