Description:
To conduct the analysis, a dataset containing information about laptops was selected. This included characteristics such as manufacturer, device type, screen size, resolution, CPU type and frequency, RAM capacity, GPU type, operating system, weight, and price in Euros. The data was downloaded from the Kaggle platform: https://www.kaggle.com/datasets/ironwolf437/laptop-price-dataset?resource=download.
Rationale for Selection:
Relevance: These data illustrate current trends in the laptop market, allowing for the identification of patterns in the relationship between price and specifications.
Informational Value: The diversity of parameters (processor specifications, memory capacities, GPU types, and others) facilitates in-depth analysis and highlights the primary factors influencing device cost and popularity.
Practical Value: Data analysis helps potential buyers navigate laptop selection, while helping manufacturers understand user demand and preferences.
Charts:
During the analysis, I decided to use the following types of charts:
- Histograms
- Bar Charts
- Scatter Plots
- Ridgeline Plot (density distribution chart)
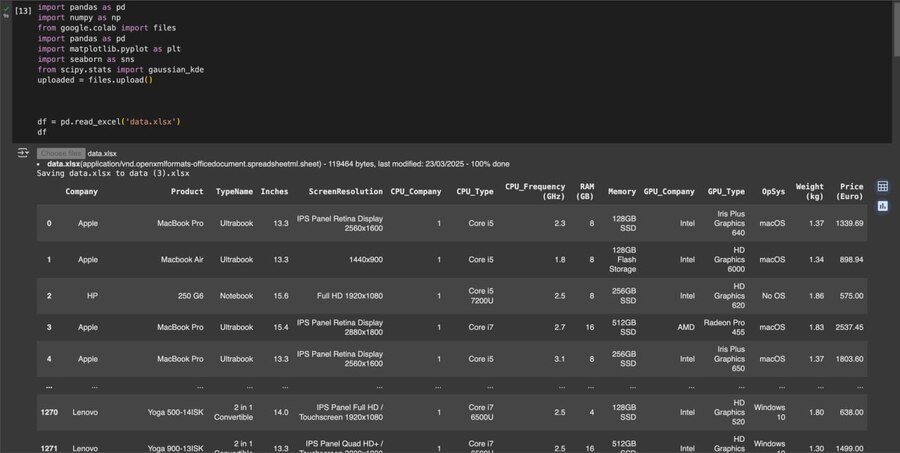
Dataset structure
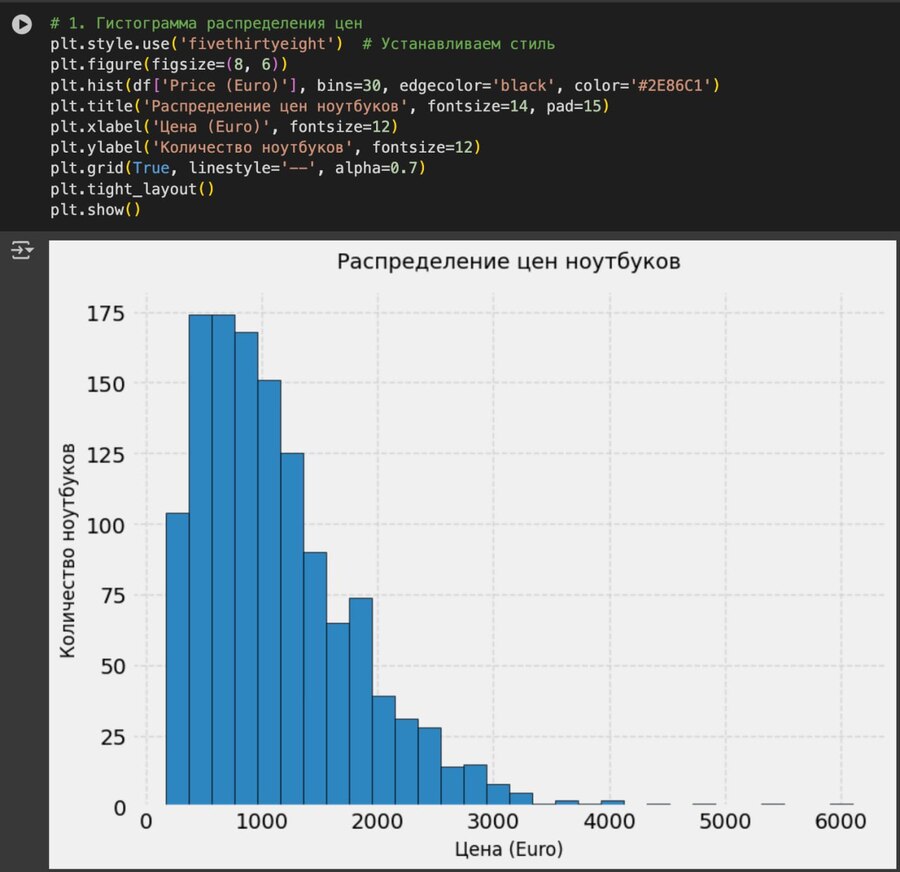
• Price ranges: The histogram revealed the main price clusters among laptops.
• Manufacturer Dominance: The bar chart illustrated which manufacturers were most frequently represented.
• Characteristic Correlation: The scatter plot demonstrated how RAM capacity correlates with price, while the line graph illustrated processor frequency dependence on price.
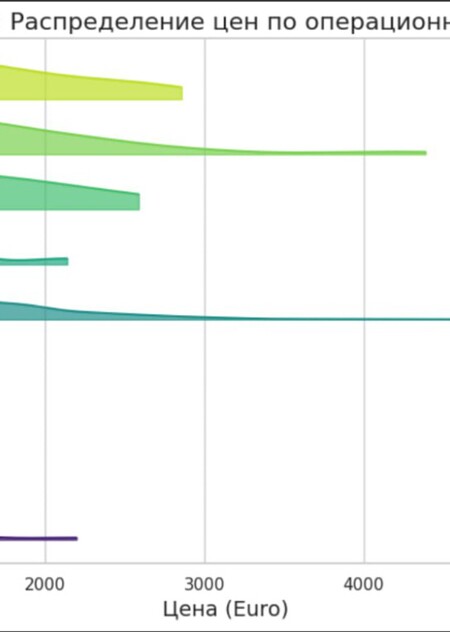
• OS Comparison: The Ridgeline Plot allowed for a comparison of price distributions across various operating systems, revealing their unique characteristics.